
The return from the summer break has been anything but smooth. While the focus has been on the Sights, there are other issues, such as long-term trends, that are becoming clearer as we dive deeper into the current crisis.
After initially posting mistaken numbers, the Kimberley Process Certification Scheme (KP) published its rough diamond production, import and export figures for 2014. These figures are full of surprises, underscoring some of the changes the global diamond market is growing through. They point to changes in the importance of certain diamond centers, and that has an impact on the entire pipeline.
Russia rises to the top slot
In May 2013, ALROSA’s then First Vice President Executive Director, Igor Sobolev, told me during a visit to their mines in Mirney that ALROSA would be the world’s largest diamond company by 2018. It was a clear goal that the company had set out to achieve. Even though we are three years away from 2018, and the economic environment is very different today than it was in 2013, there are signs that ALROSA may soon be achieving its goal.
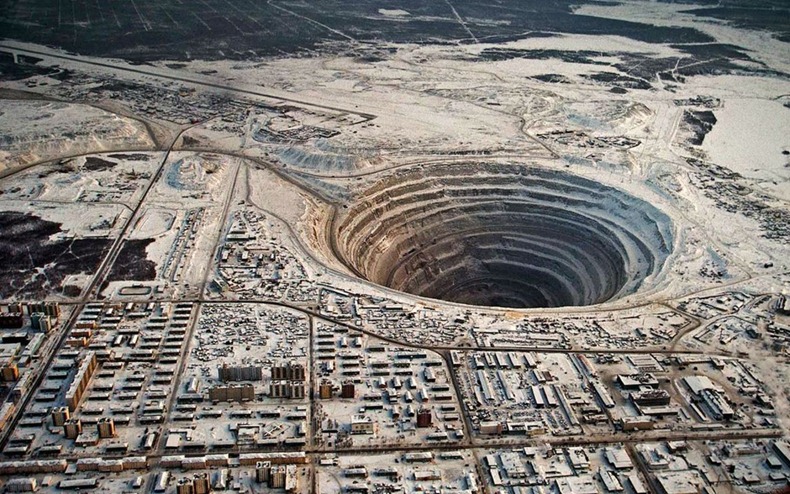
In addition to mines in Russia, ALROSA owns a stake in one mine outside of the country, in CATOCA in Angola. With that exception, all of the company’s mining activities are within Russia, and with hardly any exception, 94.5% of Russian production belongs to ALROSA.
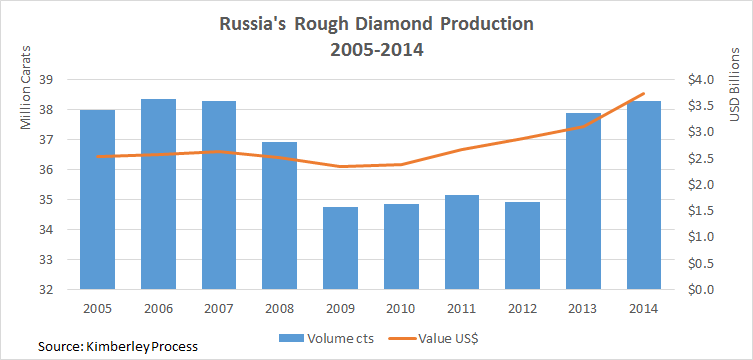
In 2014, Russia produced 38.3 million carats with a stated value of $3.73 billion, making it the world’s largest diamond producer by value and volume, according to the KP. Until 2014, for many years it was the largest producer by volume only. The 19.9% increase in value compared to 2013 may only be an increase in the books (the volume increased only by 1.1%) or maybe a chance improvement in what was extracted from the ground, but as ALROSA may state, there is no chance or play. Russia/ALROSA as one are simply continuing on a pre-set path to achieve a goal.
Botswana slips to 2nd place
In retrospect, ALROSA’s growth in production may just be the difference between a government-backed miner and one owned by a publicly issued group driven to show growing profits every quarter. When ALROSA faces a difficulty selling rough, it has the backing of Gokhran, the State Precious Metals and Gems Repository.
Gokhran has an annual budget to buy rough diamonds from ALROSA. This allows the company to keep mining even in the harshest times. To generate revenue, it sells the goods to Gokhran, which in turn, only needs to wait for better times in order to sell the goods on the market. This is a way for the Russian government to protect ALROSA.
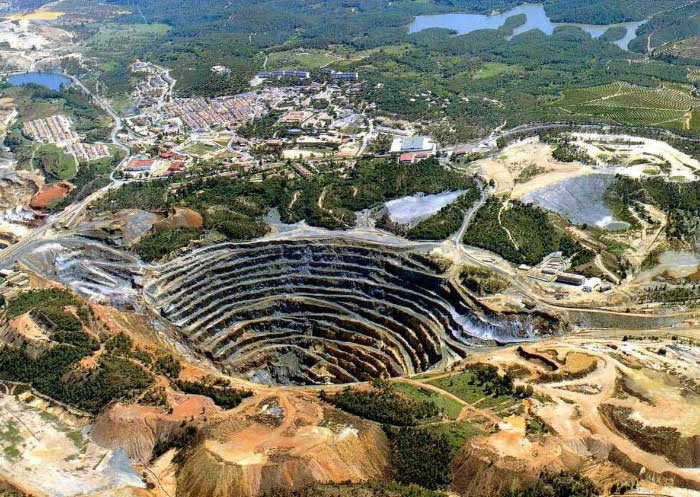
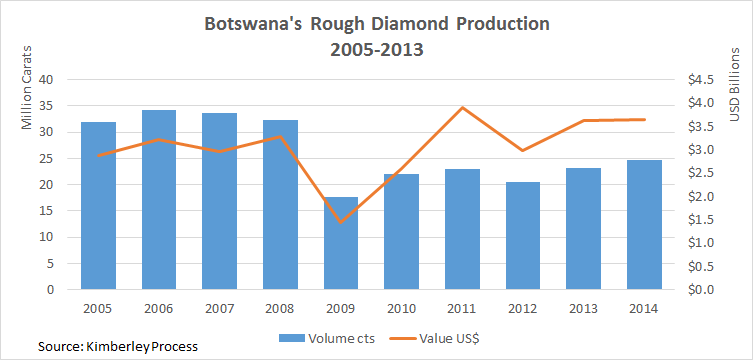
Botswana produced 24.7 million carats with a stated value of $3.65 billion in 2014, a 6.4% rise in volume, but only a 0.6% increase in value. De Beers mined 98.3% of Botswana’s 2014 output, making it as important a company for Botswana’s diamond mining as ALROSA is for Russia’s.
However, from De Beers’ perspective, Botswana is 74.3% of its global production in 2014, as this company has a greater geographical spread. When clients don’t buy as much (as the situation is today), De Beers reduces production (as it is doing now). All this is to say that when released in Q3 2016, the KP figures for 2015 may show that Russia has increased its lead over Botswana.
Global production up by value, leading to price increases
[two_third]
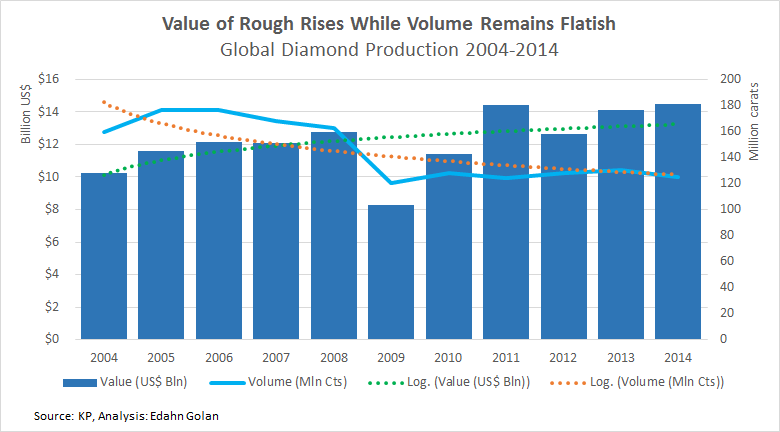
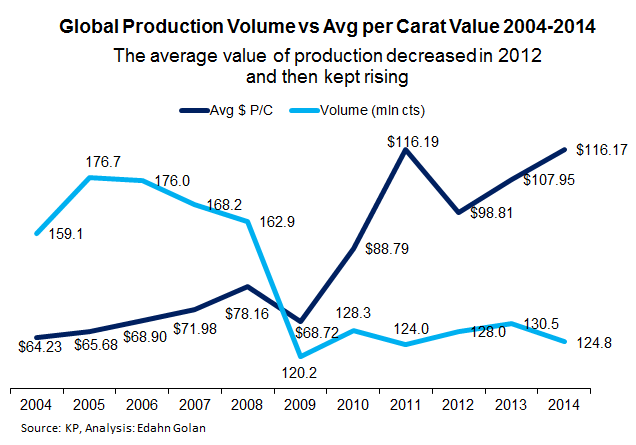
According to the KP figures, global diamond production in 2014 was 124.8 million carats, valued at $14.5 billion, a 4.4% decrease in volume and a 2.9% increase in value compared to 2013.
This bodes well with what the manufacturing sector of the diamond pipeline warned throughout the year – that there is a scarcity of certain goods, and prices went up. According to these figures, overall, prices at the mining level increased 7.6% in 2014.
[/two_third][one_third_last]
“Global diamond production in 2014 was 124.8 million carats, valued at $14.5 billion, a 4.4% decrease in volume and a 2.9% increase in value compared to 2013.”
[/one_third_last]
The public KP data is broken down according to production, imports and exports of rough diamonds, tracking them as they cross borders. The stated value of rough diamonds at the mining level (and as recorded by the KP), is not necessarily what rough diamond buyers pay the miners. Nothing underscores this better that the rise in the average value of rough diamond imports.
According to the KP, 409 million carats of rough diamonds worth $56.6 billion were imported by 36 countries, a 5.7% decline in volume and a 5.3% increase in value.
Once again, this rise in value may reflect a higher proportion of pricier rough that was by chance mined during the year. That is doubtful because of the large variety of sources. Moreover, this would also be reflected in the production figures.
What this double-digit rise in value more likely shows is what happened in the trade – miners charged more for their goods and first hand buyers (Sightholders and contracted ALROSA clients) took a larger premium when selling to the secondary market. These are some of the issues related to the current crisis in the diamond pipeline.
Top five producers
Following Russia and Botswana, Canada, Angola and South Africa were the world’s top five producers in 2014. Together they mined more than 82% of the world’s supply by value. The difference between 2014 and 2013 is worth considering. First, the top five represented a larger share of total production, as shown in the table below.
This is a consolidation at the top. The biggest producing countries are holding a greater share of the supply by value. At the same time, the top 10 producing countries were virtually unchanged – 97.9% of global production in 2014 versus 98.1% in 2013, a difference of 0.2%.
Among the top five, Canada retained its third largest producer spot, Angola rose from fifth largest in 2013 to fourth in 2014, and Namibia is no longer a top five producer after its production slipped 15%.
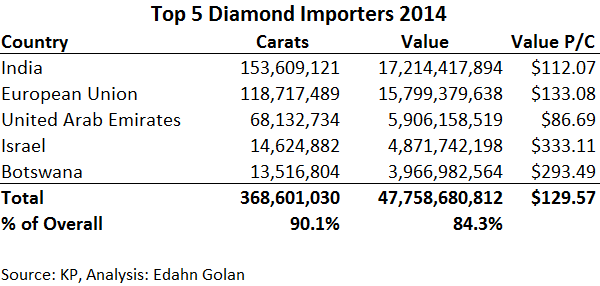
Top five importers & exporters
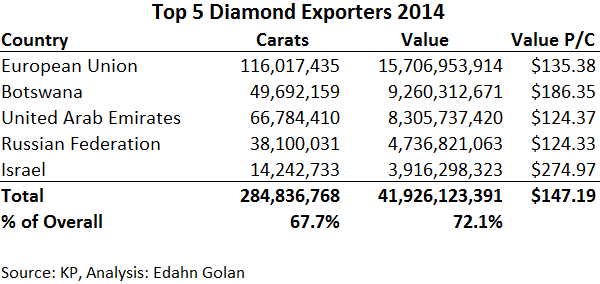
Not surprising, the top rough diamond importer was India, the leading manufacturing center. The European Union is second because of Belgium, a leading rough diamond-trading center, followed by the United Arab Emirates. However, these latter two may switch positions in the not far off future.
The UAE is increasing in importance as a trading center, as the value of rough imports has increased 17.6% year-over-year. Conversely, EU imports declined 9.6% in 2014.
Israel was able to maintain the value of rough diamond imports in 2014 according to the KP; however, the volume of imports declined more than 16%. This may be a reflection of the center’s growing focus on higher value goods. Botswana, which hosts De Beers’ sorting facility, completes the list of top five importers.
No surprises exist among the top exporters. The top rough diamond exporters are the leading trading centers. The same trends seen among the leading importers are again reflected, most notably, the declining level of trade through the EU (Belgium, really) and the rising trade through the UAE, where Dubai is located.
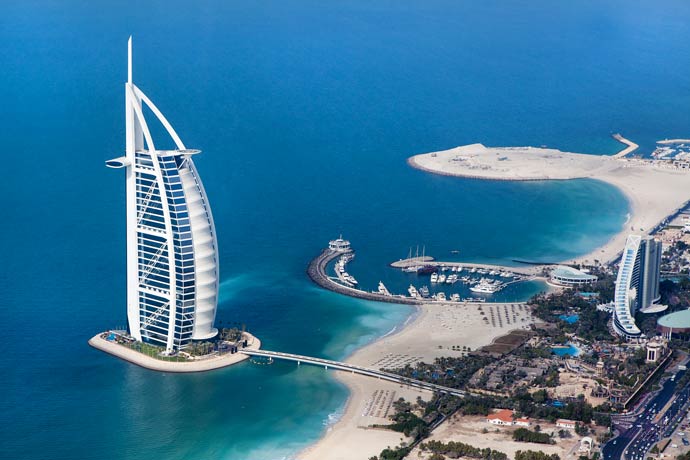
Dubai is an attractive center for diamond companies, mostly because of the 50-year tax amnesty provided to companies in the Dubai Multi Commodities Centre (DMCC). With very thin margins of just a few percent, the ability to do business in a no-tax environment – and transfer profits from a high taxation country – has given rise to Dubai as a trading center.
Noteworthy points
In its 2014 Consumer Diamond Jewellery Demand Overview, De Beers estimated 2014 global rough diamond production at 142 million carats, stating that production decreased by an estimated 3%.
De Beers, in its research, includes more production than was captured by the KP. The biggest additional production is mostly from the Democratic Republic of Congo (DRC). It also estimates the value of production at a much higher figure than that reported by the KP – $19.3 billion, adding that this is an increase of 6% from 2013.
De Beers’ figures are far from the KP’s, differing by 13.8% in volume and 33% by value. De Beers is an “on the ground” operation, much more so than the customs officials who collect the data in producing countries. Is it possible that KP is missing nearly 14% of the goods produced worldwide?
This is an alarming figure. Is this an illicit trade that diamond folks walking around the countryside see, but government officials miss – if not turn a blind eye to? If the answer is “yes,” then the diamond industry may have an important issue that it urgently needs to address.
A second point is the difference between the average value of UAE’s imports and its exports – 43.5%. The volume of UAE’s rough diamond imports and exports are very close – the same goods that come in go out. That is not surprising because Dubai is a trading center, not a manufacturing center. However, the difference in value is very large.
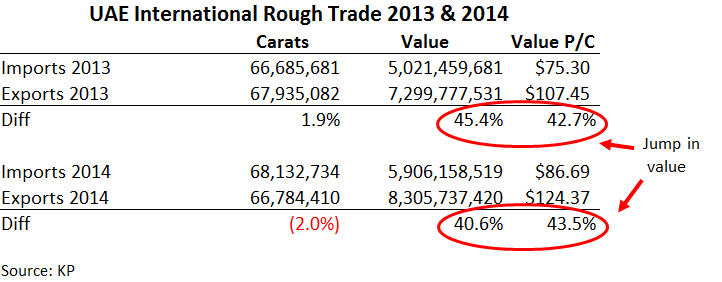
Every center adds value to its rough diamonds. Usually, however, it is a few percentage points: Belgium’s 2014 added value was about 5.5%, Switzerland’s 10% and the EU’s 1.7%. The disproportionate added value to rough going through Dubai is the alleged transfer of value.
Another point has to do with the publication of the KP’s figures this year. On July 28, it publicly published the 2014 figures. The report contained a number of glaring mistakes, such as that 2014 production was 188 million carats worth $1.9 billion.
Apparently, the source of the mistake was a tripling of Botswana’s production in the second half of the year, with a similar mistake made in the Russian figures. It must be asked – why were erroneous numbers published in the first place, and what does this say about the KP’s oversight capabilities?
Russia’s and Botswana’s numbers were conspicuously large, and a production total of 188 million carats/$1.9 billion is so out of tune, it should have stood out prior to publication. I’m not intimate with the administration of the KP, but it’s worthwhile to consider beefing it up.
This team should include not only a good group of knowledgeable people in addition to the few that are already working there, but maybe a small research entity is needed as well. They could investigate, for example, the large discrepancies between De Beers’ estimates and their own.
Sight week
Sight 7 is taking place this week. We already know that De Beers lowered prices on many boxes, mostly of mid-size goods. These price decreases, after adjusting for changes in assortments, are anywhere from 2% to as much as 13% compared to Sight 6. The average price decrease is probably around 8%, according to Sightholders.
De Beers is offering fewer goods, both in terms of volume and variety. Many commonplace boxes were not offered at all this Sight, which an early estimate puts at $200-$250 million. Yet, Sightholders are still unhappy. According to several insiders, the prices of both smaller and larger goods were not reduced enough to make them profitable.
The good news is that De Beers is aware of the issues in the market. Now that Anglo American’s second quarter figures are out, the sales team at De Beers can make the necessary adjustments. As Philippe Mellier stated during a speech at a Sightholders lunch this week: Buy what you need; keep your own margins – that’s your business. This is a call to action for us all.