
The 2011 global production data published by the Kimberley Process (KP) last week presented a vastly different market scenario than what is the reality today. Then again, a very different atmosphere has engulfed the industry in the past seven months, influencing a drop in demand for rough and its resulting polished.
While the market peaked in July 2011, it has since been on a steady decline, causing the mining companies to curb their supply in one way or another. In the case of the major rough suppliers, they have managed to hold back supply by maintaining steady prices in a depressed market. Either way, the growth in production and prices seen in 2011 is not expected to be repeated in 2012.
The KP data showed that the value of global diamond production rose 26 percent to $14.41 billion in 2011 as higher rough prices compensated for the lower quantities mined. Production by volume fell 3 percent to 123.99 million carats, while the average price increased 31 percent to $116.19 per carat. In context, the diamond mining sector has maintained lower but relatively steady levels of production since the economic crisis of September 2008. Meanwhile, the value of production has increased and surpassed 2008’s peak levels already in 2010 (see Figure 1). A strong and somewhat speculative market in the first half of 2011 further catapulted prices skyward.
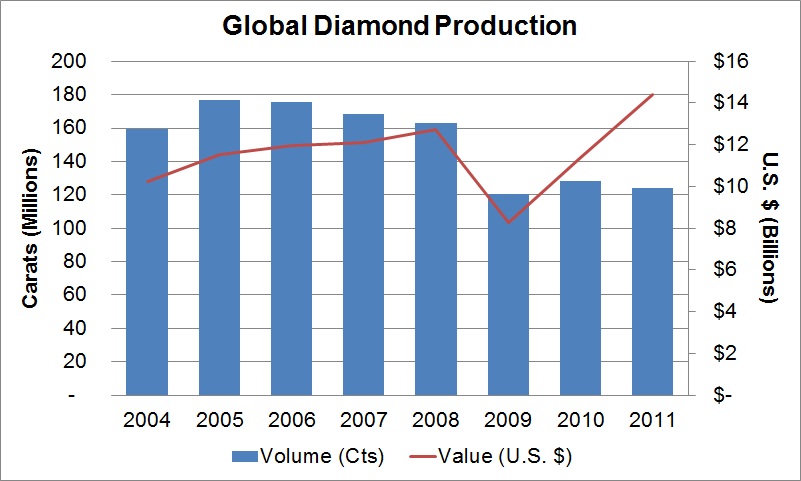
Figure 1 : Based on data published by the Kimberley Process
The Rankings
As in previous years, Botswana was the largest diamond producer by value while Russia ranked as the largest producer by volume. This was in line with the respective earnings posted by the two largest mining companies for the year whereby De Beers – which has about two-thirds of its production mined in Botswana – had the highest revenue, while Russia-based ALROSA mined more carats of diamonds. De Beers other main mining locations also featured strongly with Canada ranking as the third largest producer country by value, South Africa fourth and Namibia listed in sixth place (see Figure 2). Fifth place was occupied by Angola, where ALROSA owns one-third of the country’s largest mine, Catoca, and state-owned Endiama has a majority stake in most diamond mines.
Other large-volume producers included Zimbabwe, with its Marange mines accounting for the majority of the country’s low-value output, while Rio Tinto’s Argyle mine accounted for the bulk of Australia’s diamond production. The Democratic Republic of the Congo (DRC) ranked as the third largest producer by volume but its low-priced diamonds kept the overall value of its production down.
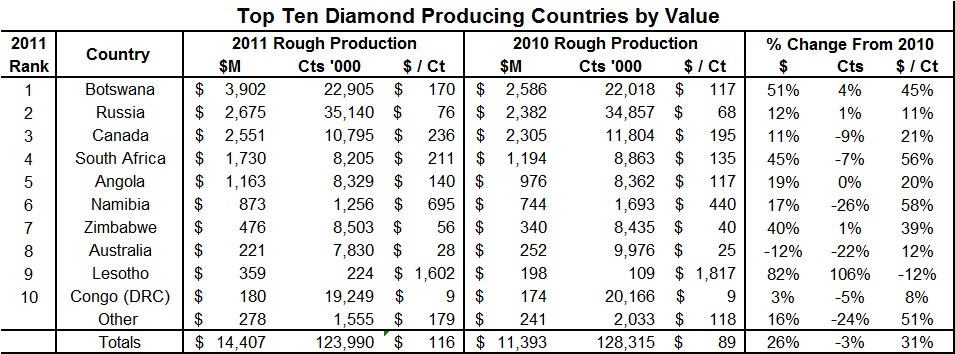
Figure 2 : Based on data published by the Kimberley Process
Average Prices
The growth in the average price of production since 2008 has varied according to the category of goods being mined, with the mid-to-higher priced production outpacing the lower priced goods.
South Africa’s production, which had an average price of $211 per carat in 2011, is up 120 percent from 2008. Lesotho, with its high-value Letšeng mine, had an average price of $1,602 per carat in 2011, which was 82 percent higher than 2008 levels, despite being among the few countries to register a decrease in price in 2011. The average price of Russia’s production, which stood at $76 per carat in 2011, was up by just 12 percent since 2008 (see Figure 3).
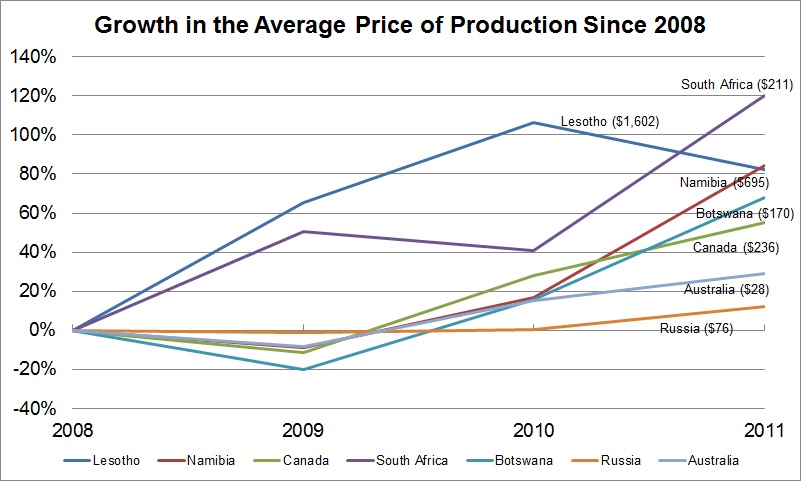
Figure 3 : Based on data published by the Kimberley Process
Similar trends were seen in the manufacturing and trading centers as the global consumption of diamonds — calculated as a function of production and rough imports less exports –— rose 22 percent to $12.47 billion in 2011, while consumption by volume fell 3 percent to 124.24 million carats. The consumption of rough diamonds in India, the world’s largest cutting center, rose 22 percent by value to $12.48 billion, while by volume, the country’s consumption fell 28 percent to 95.04 million carats (see Figure 4).
Israel, which serves as a higher-end manufacturing niche and a rough trading center, saw its consumption rise significantly by both value and volume during the year. Import and export activity also rose at other major hubs such as Belgium and the United Arab Emirates (UAE), which were net exporters of rough diamonds in 2011.

Figure 4 : Based on data published by the Kimberley Process
The year 2011 was split into two halves with the first half being a period of strong growth and speculative trading until the market turned in August. The rough market overheated and cutting center liquidity dried up, particularly in India, because manufacturing costs had increased with rough prices. Since August 2011, a steady downtrend has enveloped the diamond market which has been evident in polished and rough prices, as well as in trading and production levels. But while the lesson from the 2008 crisis to hedge the risk of a downturn by keeping lower inventories was learned and implemented across the pipeline, it is one that has been amplified in 2012.
Rapaport records show that the combined production by volume among the top five mining companies that publish their data – ALROSA, De Beers, Rio Tinto, Petra Diamonds and BHP Billiton – fell by 9 percent year on year in the first half of 2012 (see Figure 5). These companies together accounted for about 65 percent of the KP total in 2011 and an estimated 80 percent to 85 percent by value.
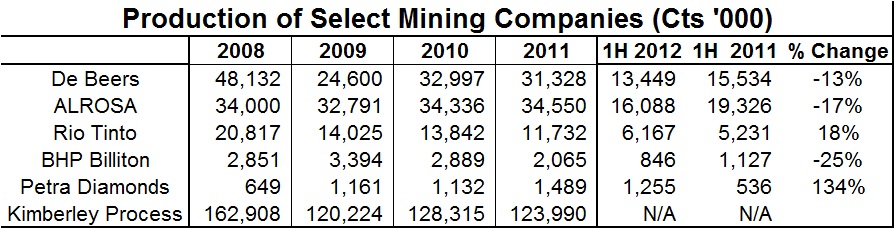
Figure 5 : Based on data published by the respective companies and the Kimberley Process. ALROSA 2H 2012 production includes Rapaport estimates for 2Q 2012.
The declines so far in 2012 are more pronounced than in previous years and one must recognize that the current lower production in 2012 is not just a function of maintaining output below pre-2008 levels. Rather, there has been a shift toward lower levels of demand in a weak global economy.
The slump in demand has been evident in the trading centers where the volume of rough being handled has dropped by significant amounts. Belgium’s rough imports and exports by volume fell by 18 percent each in the first half of the year, according to data published by the Antwerp World Diamond Centre (AWDC). Israel’s diamond controller reported that rough imports were down 53 percent and its exports by 43 percent during that same period.
Bucking the trend, India’s rough imports in fact rose 6 percent by volume in the half-year, despite challenges facing its cutting sector (see Figure 6). Market observers there note that managers are bringing goods to the factories as a means to keep them operating and maintaining their workforce, as they are loath to lose workers as they did in 2008. In addition, anecdotal evidence indicates that both rough and polished inventories in India have increased this year as a result.
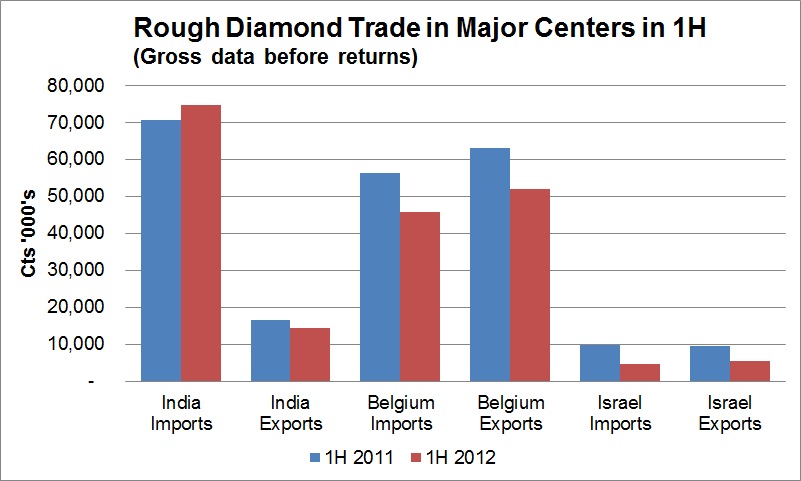
Figure 6 : Based on data published by: India’s Gem & Jewellery Export Promotion Council (GJEPC), Belgium’s Antwerp World Diamond Centre (AWDC), Israel’s Ministry of Industry, Trade & Labor
More poignant to the market is that India’s polished trade has slumped as both domestic and international demand has diminished. India’s polished exports by value fell 41 percent year on year in the first half of 2012, while its polished imports fell 76 percent. Similar declines were witnessed in other trading centers (see Figure 7). U.S. data shows that total polished imports to the world’s largest consumer market is down 7 percent and exports fell 4 percent during the same period.
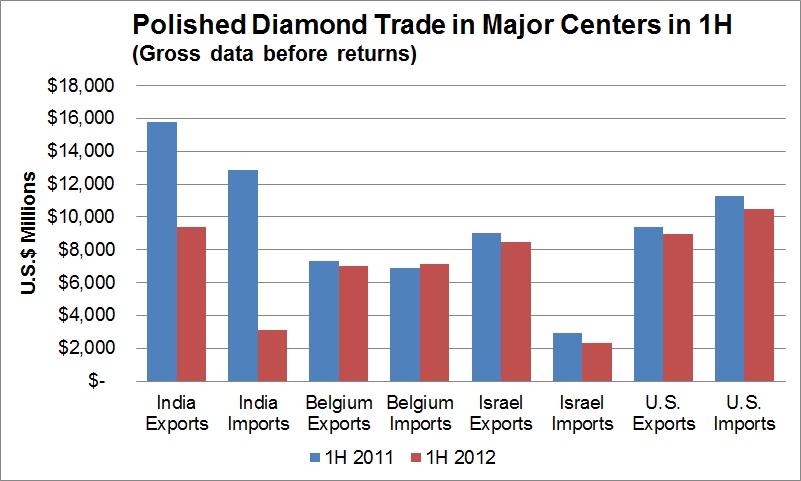
Figure 7 : Based on data published by: India’s Gem & Jewellery Export Promotion Council (GJEPC), Belgium’s Antwerp World Diamond Centre (AWDC), Israel’s Ministry of Industry, Trade & Labor, and the U.S. Commerce Department.
Profit / Supply
Demand is down as the global recession has spread. The economic boom in the Far East has slowed, while economies in the west remain sluggish at best. India’s fortunes have turned as liquidity is tight in the manufacturing sector and the outlook for its retail market remains weak.
It is therefore no surprise that rough production and trading are down in 2012 and should continue to decline on a comparative basis in the second half of the year. The more pressing issue revolves around rough prices, particularly if polished prices continue to soften.
Both De Beers and ALROSA have stated that they managed to maintain relatively steady prices during the first half while anecdotal reports indicate that rough prices in the market dropped by between 8 percent and 15 percent.
Mining companies are expected to continue to hold out for high prices thus curbing supply via out-of-synch prices. They certainly can exercise their right not to sell and maximize their own profits as shareholders require. But as this column has stressed before, such action may have an adverse effect on the distribution system, squeezing the diamond cutters and retailers, which in turn will further diminish demand.
By not adjusting their prices to meet lower levels of demand in the global economy, the mining companies need to be concerned about the negative impact on the distribution system.
While the current scenario appears gloomy, all is not lost. The volume of diamonds filtering to the market may be down, but there remain opportunities to make money, as Rapaport Group stressed in its July Rapaport Research Report.
Lower prices are healthy and necessary for the diamond market as they allow trading to adjust to lower levels of demand. The diamond trade makes money by selling diamonds, not by holding them. Dealers must learn how to make profit when prices go down by selling and replacing inventory at lower prices. The value of inventory is its replacement cost,” said Martin Rapaport, Chairman of the Rapaport Group.
Certainly, both rough and polished trading has slumped and has been more quiet than usual during the July and August vacation periods. But while next year’s KP report will reflect a far less encouraging picture of 2012 than it did 2011, the true test will be on how dealers navigated the bearish market. Ultimately, the focus remains on their ability to profit from diamonds, and not on supply.