Here’s a question to ponder: How much does the average US household spend on jewelry and watches per year? Does this spending differ by age group and, if so, by how much? Knowing how much different demographic groups spend can be very valuable to a business.
With all its recent trials and issues, the US is by far the largest economy in the world. Individual states such as California and New York have bigger economies than some of the biggest countries in the world – bigger than some super powers and OECD member countries. So, it is no surprise that the US is the largest jewelry and watch consumer market.
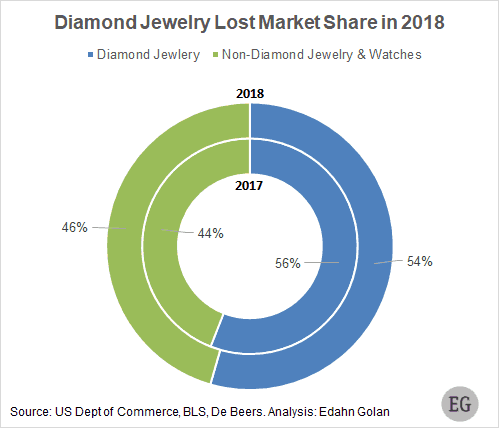
Diamond jewelry is losing market share in its most important market
In 2018, US jewelry and watch sales totaled $82.5 billion. About half of this total is attributed to diamond jewelry sales. In 2018, there were 127.6 million households in the US. A simple back-of-the-envelope calculation tells us that, on average, $647 was spent on jewelry and watches by each household. About $352 was spent per household on diamond jewelry, assuming a 4.5% growth in sales in the US in 2018. This growth in diamond jewelry sales in 2018 is a generous assumption, but it is good for our calculation.
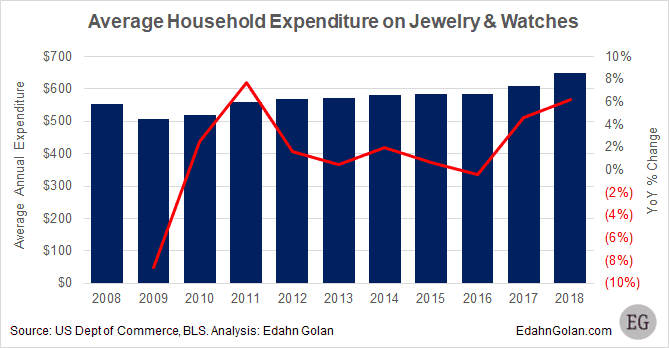
Year-over-year, the average expenditure on jewelry and watches per US household increased 6.2%. This, while expenditure on diamond jewelry was up just 3.4%.
The difference in growth between all jewelry and diamond jewelry is alarming. Because diamond jewelry sales did not keep pace with all jewelry sales, diamond jewelry lost market share in the jewelry category. This is something to ponder.
Top spenders’ demographic breakdown
The overall figures are interesting as indicators of general consumer consumption. They do not, however, tell us which demographic group is buying more jewelry than others. An analysis based on the mid-year Consumer Expenditure Survey by the US Bureau of Labor Statistics provides some insights.
The age group with the highest expenditure on jewelry and watches are 55-64 year olds. On average, they spent $1,231 per household during the second half of 2017 and the first half of 2018.

By income, those earning $200,000 or more had the biggest expenditure on jewelry and watches. They spent, on average, $1,657 per household, nearly triple the average. This is not very surprising. Neither is the finding that those with master’s and doctoral degrees had the highest expenditure when measured by education, $994. Higher income and higher education often go hand in hand.
Another finding is that singles living alone spent more than average, 2.6 times, to be exact. Going down the list, the households that spent the most are well educated, high earners and singles living alone. To complete the picture, they are also white, live in the Northeast, and own their homes, though most have a mortgage.
Earn less, spend less? Not necessarily
While it’s almost not surprising who the top spenders are, it is those who spend the least that offer some surprises. One surprise is that those that earn $30-40,000 a year spent the least, as measured by income. This is surprising because those who earn the least, $15,000 and less, spent near the national average of $615.