
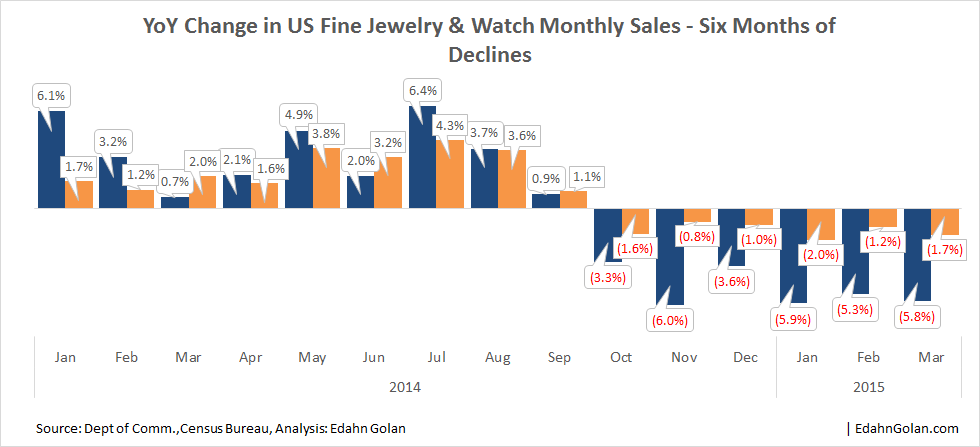
Based on official US government figures, between October 2014 and March 2015, retailers lost $550 million in fine jewelry and watch sales.
During the equivalent period in 2013-2014, overall fine jewelry and watch sales in the US totaled $43.58 billion, falling to $43.03 billion during the six months of October 2014 to March 2015.
Industry indicators say
In the 2013-2014 period, specialty jewelers’ sales totaled $17.31 billion, declining to $16.49 billion in the 2014-2015 period, a loss of $816 million. You may look at the figures and ask yourself how it is possible that the total decline is smaller than the decline among a segment. The answer is that sales at “other” retailers, multi-item retailers, actually increased in the period. Specialty jewelry retailers, on the other hand, lost business and market share.
Consumer prices declining
The shrinking sales figures indicate a decline in demand. Retailers are reporting less traffic into their stores and that sales are shifting to smaller, less costly items, pointing to a rise in prices of fine jewelry that has led to further decline in interest.
Prices of fine jewelry have been declining since early 2012, so is this really the issue? Following is an index of consumer prices (JCPI – Jewelry Consumer Price Index), a measure of the average change over time in the prices of fine jewelry as paid by consumers.
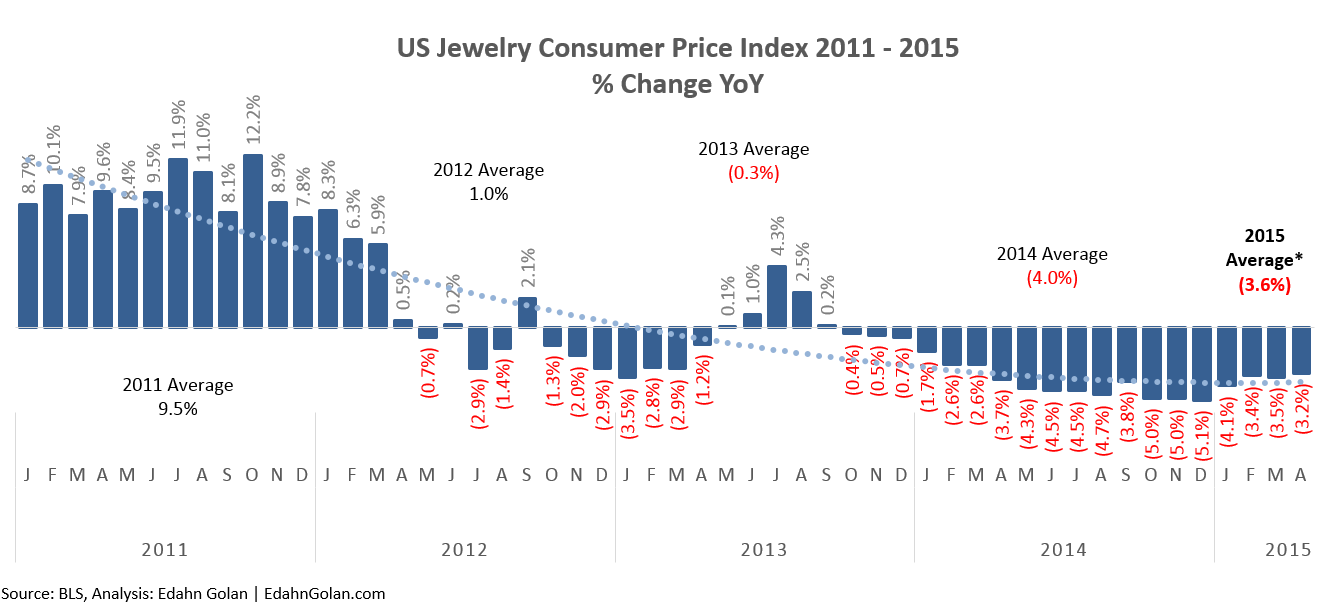
With the exception of a surge in mid-2013, prices have been heading south for many long months. So where are they today? Imagine a fine jewelry item that is representative of the changes in average prices in the US market. Let’s say that it cost $1,000 in December 2010, the month before the above graph starts, and let’s follow the month-over-month changes in its price since that time.
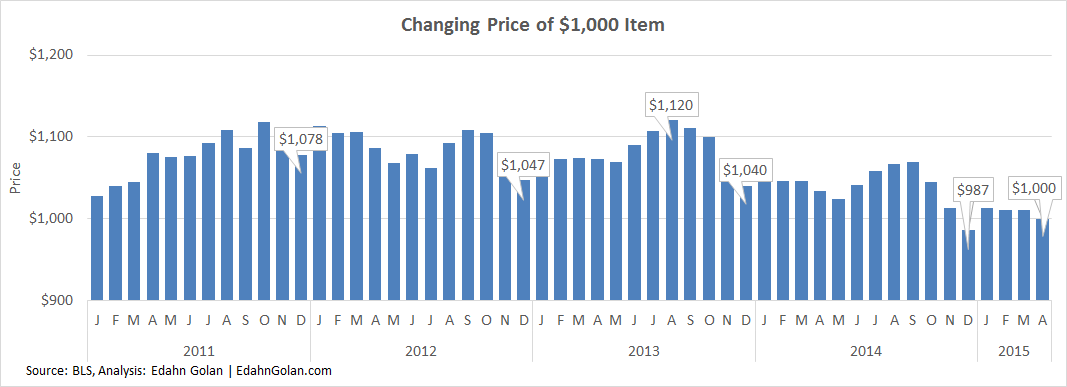
The small, yet constant price increases throughout 2011 brought the price of this sample item to $1,078. The compounded monthly price increase hiked up its price 7.8% by December 2011. By December 2012, it softened to $1,047. It hit a record $1,120 in August 2013, and despite some price increases, by December 2014, the price of this item fell to just $987, a 1.3% decline from December 2010. According to the latest available data, prices increased and brought the item’s price full circle back to $1,000 in April 2015.
Economic indicators say
We know diamond prices peaked in mid-2011 and have been slowly softening ever since. The price of gold peaked in September 2012 and has also been heading down since then. With the cost of the main components decreasing for so long, and with a strong dollar compared to the Indian rupee, for example, the cost of labor is decreasing too. So is cost of jewelry really the issue?
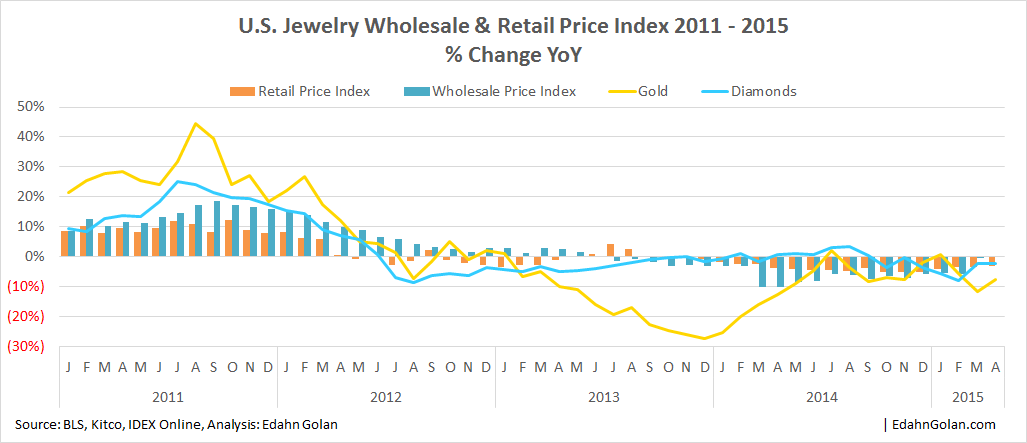
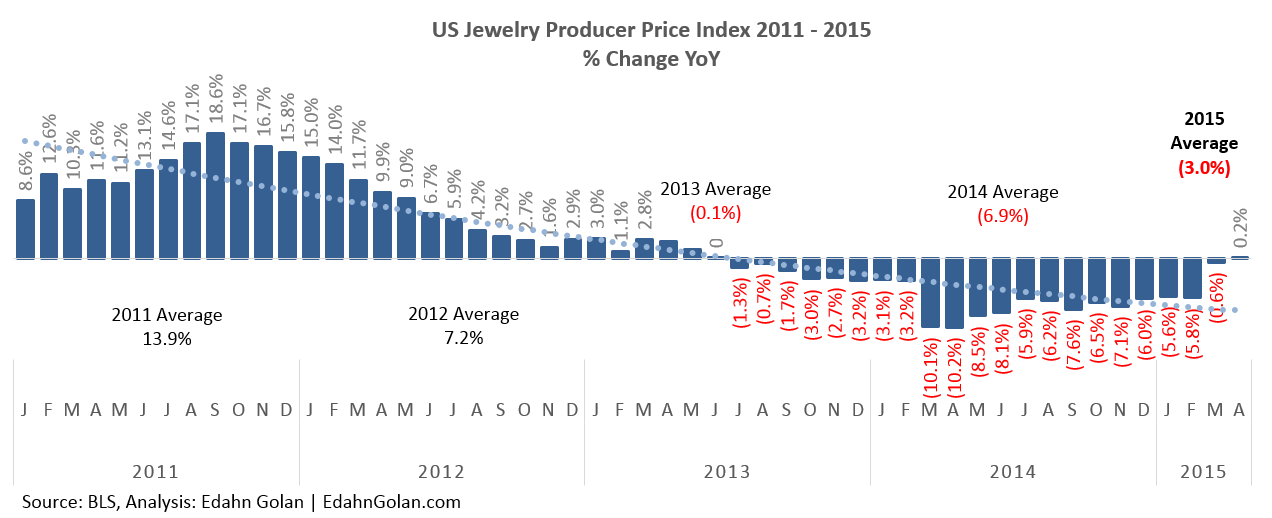
Another piece of data tracked by the US government is producer prices. Its Jewelry Producer Price Index (JPPI) is an index that tracks average change over time of real selling prices by US jewelry makers. Here, too, we see a decline in the price producers are charging retailers.
The decline in sales is not necessarily an issue of high prices or a bad price reputation; after all, diamonds and diamond jewelry are luxury items, not a necessity. The half-a- billion dollars in lost sales is a figure significant enough not to be dismissed as a phase. Instead, it warrants a closer examination. In the past, a decline in demand in diamond jewelry preceded wider economic declines. Closer to home, it may simply be a fading awareness of this category among consumers.